- Contents
HDR Imaging and Tonemapping
13 Apr 2022
§ The Problem
The real world is in high dynamic range. A camera sensor is unable to capture in HDR; as bright spots may oversaturate a photosensor and force it to white – losing information in that area. We can modify our exposure time to adjust the amount of light that enters the sensor – but there is no one exposure time that will give us a good picture, so we must take many.
§ Many-to-one
Camera Pipeline:
- 3D Radiance ()
- Lens
- 2D Sensor (Irradiance, )
- Shutter (Exposure time, )
- Sensor Exposure
- ADC (Analogue to Digital Converter)
- Raw Image
- Remapping
- Pixel Values ()
Our goal is to go from to , however, to fully go to we must reverse the ADC – we have no interest or intention of doing so. We can note that is invariant to exposure time, so if we know we can find – typically is given as metadata on an image.
We need multiple images to recover the vs curve – typically with varying .
§ Camera Response Curve
Then, our goal is to find or the exposure sensitivity for the th pixel.
Objective: Solve for in , where represents the value of pixel on image , and is the exposure time on the th image.
Using algebra, we get
In the above expression, the values and are known, and and are unknown.
Through optimization, we may solve for the unknown values by via the following
where is the number of pixels, the number of images.
Number of Samples
For an 8-bit color depth image, values, then there are 256 unknowns for the function , i.e. We also have unknowns for .
- There are unknowns
- There are total equations
Then, . Usually is sufficient, e.g. if then random pixel samples is sufficient to recover .
This makes the assumption that the images are reliable – however, this is not the case, we modify our equation to
- is a function that assigns a weight to a pixel value; we want large values to map to smaller values, as these are generally unreliable. One possible function is the triangle function given by
where is the bit-depth of the image. 2. There is no reason for a manufacturer to use a noisy curve; therefore, by making the assumption that the camera's response curve is smooth,
- is a factor used to balance the two terms – a larger gives a smoother response curve.
We only need to perform this optimization once per camera, then we can reuse it for other images; sometimes this method is called "irradiance calibration".
§ Tonemapping
Previously we solved for or for every pixel we get estimates for we cannot just use the arithmetic mean as the highly irradiant areas in longer exposures will bias the mean.
We can then reuse the weight function to get a weighted mean,
Having recovered the irradiance of each pixel in an image, we can now use it in various applications such as reusing the irradiance in a computer rendering or in viewing an image – however, we must compress the high dynamic range into the range displayable by a device.
- Clipping
- Causes the loss of detail in highly irradiant areas.
- Scaling
- Causes the loss of detail in areas of low irradiance.
- Reinhard Global Operator
- Better than scaling and clipping as it increasly sharply at small values (boosting), and compresses the high irradiance areas.
- Gamma Compression
- We first perform scaling, then a gamma correction to boost the smaller values like Reinhard.
- Colour gets washed out.
- Gamma Compression on Intensity
- Intensity is given by
- Then, gamma compression on intensity
- Colour is given by ParseError: KaTeX parse error: Got function '\\' with no arguments as argument to '\left' at position 21: …frac{1}{L}\left\̲\̲{R, G, B\right\…
- Then, the final image is computed via
- This preserves colour, but instead washes out intensity – or lowers the constrast of the image.
§ Chiu et. al (1993)
In Chiu[1], the authors propose the following method:
where is the Gaussian function,
Their process can be visualised by the following image,
Their motivation was to use a lowpass filter (here, we used the Gaussian as an illustration) to isolate ranges of radiance that are perceptually important.
Unfortunately, this approach leads to a "halo" effect around sharp irradiance transitions due to undesirable easing of a transition in a step-like function.
To understand why, we turn towards the definition of the convolution,
We may notice that is a weighting on that is dependent on the spatial distance between the two pixels and
Visually, we can see the effect that this spatial weighting has on the step-like result that we desire
§ Tomasi and Manduchi (1998)
In Tomasi[2], they explore a method called "bilateral filtering" to reduce the halo effect.
The method is given by the following adjustment the convolution calculation
where
The and functions represent the spatial and colour filters – now instead of weighting just the spatial distance of two pixels, we also use the "colour distance".
§ Durand and Dorsey (2002); Paris and Durand (2006)
In Durand[3], they explore a method of computing an approximation of the bilateral filter that is per pixel.
A further improvement upon Durand[3:1] was made in Paris[4]. The authors note that the product of the spatial and range Gaussian defines a higher dimensional Gaussian in the 3D product space between the domain and range of the image.
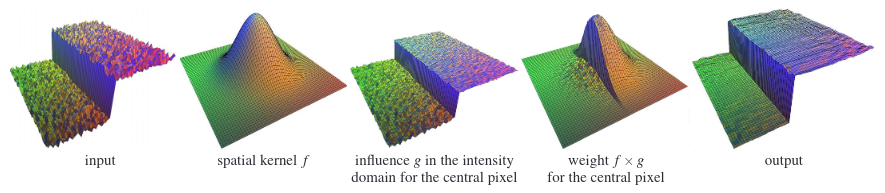
However, the definition of the bilateral filter in eq. 1 is not a convolution as it is a summation over the 2D spatial domain. The authors introduce a new dimension for the intensity for each point in the product space in order to define a summation of the 3D space.
We now define for each point an intensity , and we let be the interval for which intensites are defined. Also, we define the Kronecker symbol by
where
We can use homogeneous coordinates to express the same equation,
where
Note that the terms are cancelled when .
The summation is now over the space the product defines a separable Gaussian kernel on
Then, we construct the functions and ,
Then, we rewrite the 3D summation
Using separability of the 3D Gaussian,
This formula corresponds to the value of the convolution between and the two-dimensional function at ,
The functions and are given by
Finally, the bilateral filter can be given by
First, we perform slicing or evaluating and at then division in order to normalize the result.
K. Chiu, M. Herf, P Shirley, S. Swamy, C. Wang, K. Zimmerman. "Spatially Nonuniform Scaling Functions for High Contrast Images" (1993). ↩︎
C. Tomasi, R. Manduchi. "Bilateral Filtering for Gray and Color Images" (1998). ↩︎
F. Durand, J. Dorsey. "Fast Bilateral Filtering for the Display of High-Dynamic-Range Images" (2002). ↩︎ ↩︎
S. Paris, F. Durand. "A Fast Approximation of the Bilateral Filter using a Signal Processing Approach" (2006). ↩︎
-
- Computational-photography